

Lesson
Dashboard
Lesson 1
Family Data File
Lesson 2
Attendance
Lesson 3
Provider Payments
Lesson 4
Family Selection & Enrollment Activities
Lesson 5
Parent Involvement & Education
Lesson 6
Health & Social Services
Lesson 7
Expulsion & Suspension
Lesson 8
Community Involvement
Lesson 9
Site Licensure
Lesson 10
Adult-Child Ratios
Lesson 11
Environment Rating Scale
Lesson 12
Nutritional Needs
Lesson 13
DRDP & Education Program
Lesson 14
Parent Survey
Lesson 15
Qualified Director
Lesson 16
Staff Development/
Provider Support
Lesson 17
Refrain from Religious Instruction
Lesson 18
Inventory Records
Lesson 19
Program Self-Evaluation
Lesson 20
FCCHEN Provider Participation
Lesson 21
Contractor Parent Policies
Lesson 22
Fiscal Essentials: CFCC Contract Type
Lesson 23
Fiscal Essentials: CCTR Contract Type

Introduction to Projections
A successful organization:
Must have sound fiscal management
Manages enrollment & projections to ensure their contract is fully maximized
Reference
Watch Video Lesson ❯
Accessibility Note: The complete accessible content is available in the video and transcript below. The transcript can be accessed using the transcript option in the video player controls. The slide deck is provided for visual reference and may not be fully accessible.
Video Description: This video reviews program projections and enrollment planning for CCTR and CMIG contracts, with a live demonstration of how to manage and update projections each month.
Sample Forms/Tools ❯
Review Sketch Pad Notes ❯
Gather

When preparing an enrollment & projections plan, you must gather the following information:
Contract
Maximum Reimbursable Amount (MRA)
Contract Rate (Per-Child Reimbursement)
Minimum Days of Operation (MDO)
Predict
Interest Revenue
Family Fee Revenue
Average Vacancy Rate
Center | FCCHEN Capacity
Plan
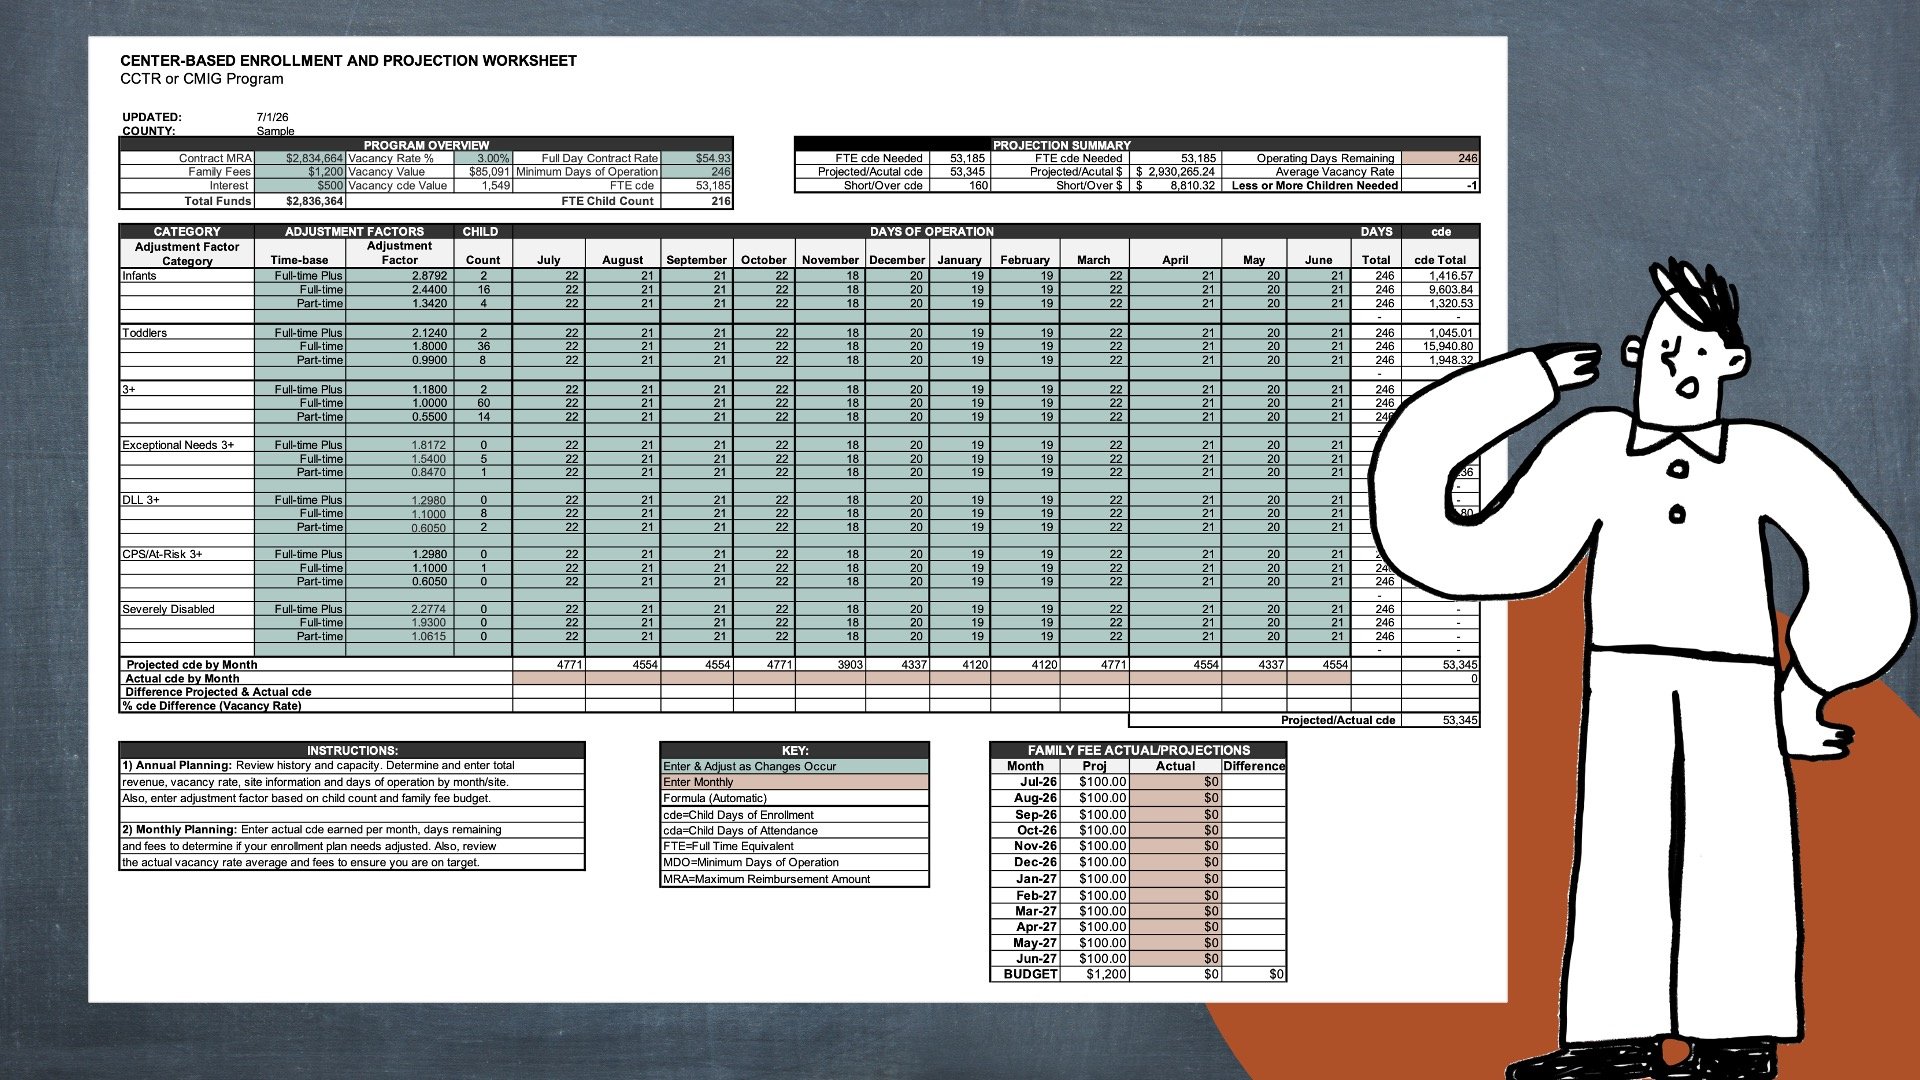
There are many worksheets out there that programs use to create an enrollment & projections plan.
To show what should be considered when planning enrollment & projections we will be using Monarch Link’s sample General Child Care or State Migrant worksheet. The workbook includes a sample projection enrollment plan spreadsheet, followed by an adjustment factor reference worksheet.
In the event that the contractor serves children in multiple counties AND the different counties have a different Contract Rate, then separate program worksheets will be needed.
For the purpose of planning, within the worksheet the TEAL COLOR CELLS are inputted AND adjusted as changes occur
Program Overview Data
Enter data into Program Overview section for each program type & if applicable each county.
EXAMPLE:

TOTAL FUNDS:
Contract MRA: Contract MRA: Contract Maximum Reimbursable Amount (MRA) is $2,834,664
Family Fees: Based on predicted fees, the projected family fees are $1,200
Interest: Predicting to receive $500 of interest (amount of interest received from program funds sitting in the bank account)
VACANCY RATE VALUE:
Vacancy Rate: Based on history of target enrollment compared to actual enrollment numbers, this program has a 3% vacancy rate.
When space sits open, agency is not earning funds during this time period. If this value is not taken into consideration, an agency will under earn the contract. Target vacancy rate should not exceed 2-5%.
FTE CHILD COUNT:
Contract Rate: Based on contract, the Contract Rate is $54.93
Minimum Days of Operation (MDO): MDO of 246 was determined by the annual service calendar & included on contract
Number of child days of enrollment (cde):
(Total Funds $2,836,364 + Vacancy Rate Value $85,091)/Contract Rate $54.93 = FTE cdes 53,185Number of daily FTE children:
FTE cdes 53,185/ MDO 246 = FTE Child Count 216
Composition

Next, determine the composition of where children will be served, adjustment factors, child counts & the days of operation.
If children are co-mingled with Head Start-only, private-pay, or other non-certified children, do not include those children in the Child Count. This worksheet should reflect only the program-specific certified children included in this projection.
Category:
Identify the applicable adjustment factor categories for the children being projected.
Infants
Toddlers
3+
Exceptional Needs
Dual Language Learners (DLL)
CPS/At-Risk
Severely Disabled
ADJUSTMENT FACTORS & CHILD COUNT:
Analyze the certified schedule of enrollment for each child according to the Application for Services.
Based on the analysis record the Child Count AND Adjustment Factor based on:
Age
Time-base category
Special Circumstance
DAYS OF OPERATION:
For each row input the total days of operation per month children plan to be served within the applicable category
NOTE: The total cde for each row/category is automatically calculated as follows:
(Total Days of Operation x Adjustment Factor) x Child Count = cde Total
Manage

In a typical year, it is important to complete monthly projections. It is not a good idea to wait until you receive the quarterly Earnings Projection Worksheet from the Department to see their projections.
When you are over- or under-earning, you must respond quickly. By the time you can enroll 1 family up to 4 months may have gone by.
Input "Actuals"

To manage projections, each month you will need to input the Actuals
For the purpose of managing projections, within the worksheet the SALMON COLOR CELLS must be updated monthly to determine if child enrollment needs adjusted
Actual cde: Input actual Child Days of Enrollment based on attendance reports
Actual Family Fees: For this fiscal year, input the total amount of family fees assessed.
Actual Remaining Days: Input the days of operation remaining
Analyze & Adjust (if needed)

Closely monitor actual earnings (cde), vacancy rate & family fees. When analyzing the projection worksheet, ask yourself:
Projected vs. Actual cde: How does the projected cde compare to the actual cde earned? Is the vacancy rate on track?
Projected vs. Actual Family Fees: How do projected family fees compare to actual family fees collected? Are budgeted fees on track?
Contract Earnings and Enrollment: Is the program under-earning/under-enrolled or over-earning/over-enrolled based on cde?
If Under-Earning/Under-Enrolled: How many additional children need to be enrolled to meet projections?
If Over-Earning/Over-Enrolled: Can the program afford to maintain the current number of children enrolled? Is there enough of a “cushion” to account for potential future under-earning or under-enrollment?
If adjustments are necessary, make the appropriate changes to keep the program on track.
Complete Knowledge Check ❯
After reviewing the video lesson & sketch pad notes, it’s time to check for understanding by completing a Knowledge Check. Note that Individual Knowledge Checks will conclude with a Certificate.